强大、直观的眼动分析软件
EyeLink Data Viewer是一款功能强大的数据可视化和处理软件。您可以在Windows、macOS和Linux系统上运行它。Data Viewer具备的丰富功能可以让您轻松完成数据可视化、分组、处理和生成报表等工作。
了解有关Data Viewer的更多信息以及它如何帮助您进行眼动跟踪研究,请与我们联系!Data Viewer需要许可证密钥才能完整运行,如果没有许可证密钥,可在演示模式下临时运行(演示模式下Data Viewer的许多功能会受到限制)。您可以通过单击下面的按钮从我们的支持论坛获取最新版本的Data Viewer的下载链接(需要注册)。此外,我们还提供了一些视频教程,帮助您更快入门Data Viewer:
简单易用
操作界面简单直观,通过软件内部的多个可配置面板和窗口,您可以对多个Eyelink眼动数据文件进行分组、可视化和处理。
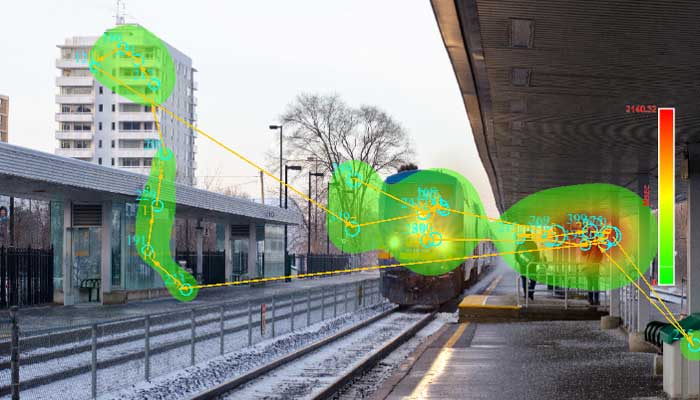
多种可视化选项
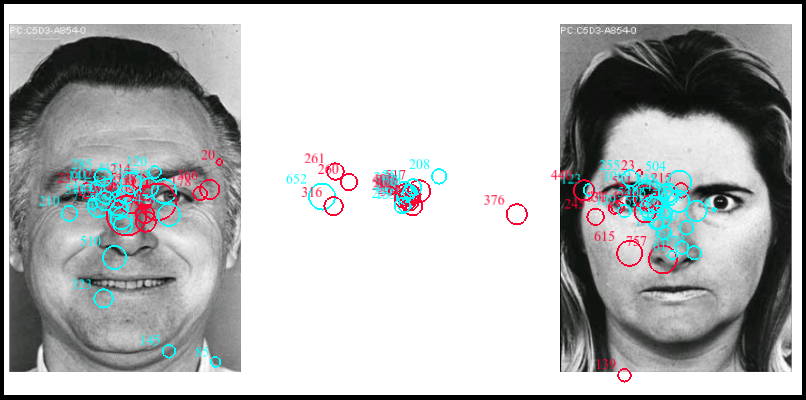
叠加视图可将注视点、眼跳呈现在背景图片上,用于创建热图和兴趣区。
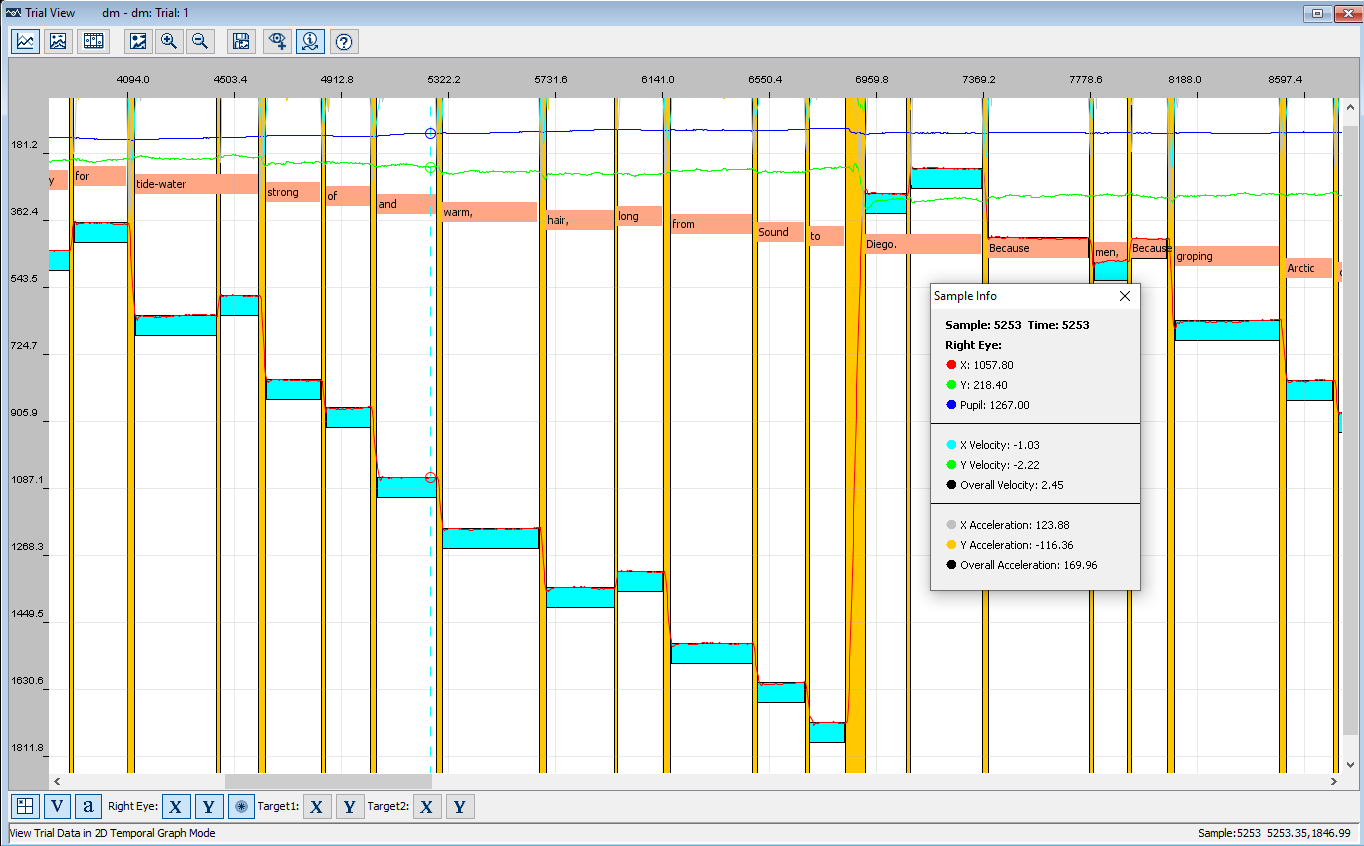
凝视和瞳孔数据可以通过时程图随时间绘制,并可选择和调整眼动事件。
在动态回放视图中,您可以回放试次并生成蜂群图和动态热图。动态回放过程中,您也进行动态兴趣区的创建和修改。
分组/筛选数据
Data Viewer可用来同时处理多个数据文件。所有数据可根据一个或多个变量进行分组,您甚至可以将不同分组的数据标记为不同的颜色,便于在实验条件之间进行比较。聚合数据模式允许您同时查看来自多个被试/试次的眼动数据。通过兴趣期的设置可以对所有试次进行分段并选中特定的时间窗口。值得一提的是,您还可以根据试次变量(如正确率)对数据进行分组或过滤,并在后续处理和数据报表中进行筛选。
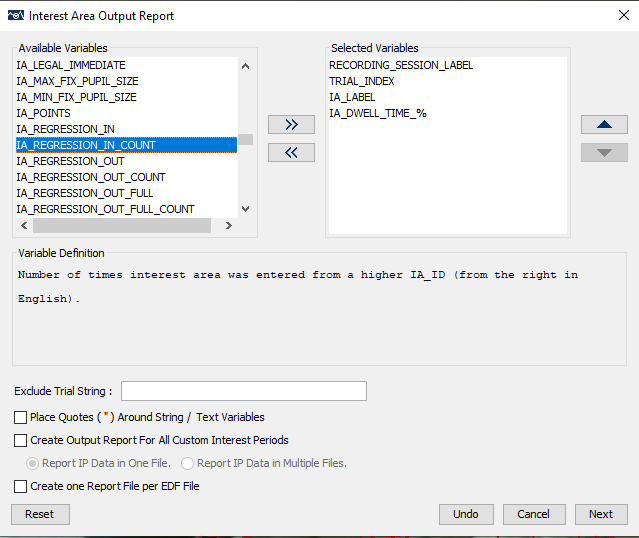
一键生成数据报表
Data Viewer可以生成试次、兴趣区、注视、眼跳甚至是采样点水平的数据报表。只需点击几下,就可生成视觉-情境范式或其他动态任务分析所需的时间进程报表。在聚合模式下,您也可以生成事件和兴趣区的数据分组报告,快速比较不同条件的关键眼动指标。Data Viewer提供诸多专用指标供您选择,如阅读研究中常用的回视次数和首次加工时间等等。此外,所有Data Viewer报表都可以直接导入Excel或统计分析软件(如SPSS和R)进行进一步处理。
Data Viewer集成协议
Data Viewer与Experiment Builder和WebLink无缝衔接。您也可以使用基于的Message集成协议,让在其他刺激呈现软件创建的实验也可在Data Viewer中进行分析。其生成的数据文件将包含支持Data Viewer进行可视化、分组和分析等功能所需的所有信息。